

Homepage design: what must be clear in 10 seconds
Visitors form a first impression before reading a word and decide within seconds whether to stay. Here is what must be clear at the top and how to test it in an afternoon.
Only 3 of 89 top-rated Czech online shops loaded main mobile content within 2.5 s. See what slows them down, how to test speed in 5 minutes, and what to ask of your vendor.

Mobile website speed at top-rated Czech online shops lags behind Google's standards. On 14 November 2026, we used Google Lighthouse 13.6 to test the homepages of 89 finalists of Heureka ShopRoku 2025—an annual award by the Czech price-comparison site Heureka, decided by shoppers' votes and an expert jury. Main content loaded within 2.5 s on only 3 of them, while 76 took over 4 s.
Loading speed decides whether a shopper buys. Content matters more to Google—77 of the 89 shops scored 90 or above on SEO. Below, we share our findings, explain Core Web Vitals plainly, walk through a five-minute test, and outline how to speed up your store.
A slow page loses shoppers before they see your offer. On Google, speed acts mostly as a tiebreaker between similar content—lost orders hurt an online store far more.
Published Core Web Vitals case studies back this up. Vodafone in Italy (March 2021) ran an A/B test where a 31% better LCP brought 8% more sales. Japan's Rakuten 24 (web.dev study, 2022) lifted conversion rate by 33.13% and revenue per visitor by 53.37%. Enterprise results do not copy over one-to-one, yet the direction is clear.
According to Google Search Central (September 2026), Google uses Core Web Vitals, yet always prioritizes the most relevant content; green numbers in Search Console do not guarantee first place.
Google evaluates mobile and desktop separately at the 75th percentile (three-quarters of visits). Phones run slower due to weaker processors and mobile network latency—your site feels different on a tram than in the office.
We ran our test on 14 November 2026 in Google Lighthouse 13.6 (emulating a mid-tier phone on a slower network), measuring each homepage once. From 154 finalists and winners of Heureka ShopRoku 2025 (announced March 2026, excluding age-restricted goods and one mobile carrier), we randomly drew 90. Lighthouse failed to open one page, leaving 89.
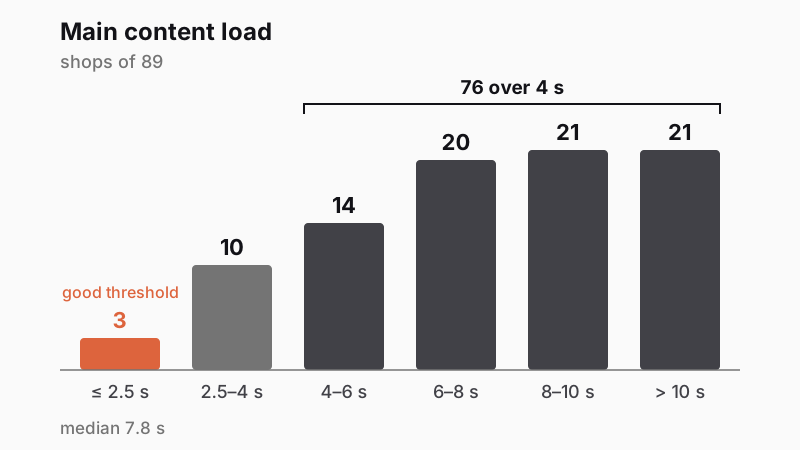
Only 3 shops finished within 2.5 s, 10 landed between 2.5 and 4 s, 76 exceeded 4 s, and 21 exceeded 10 s. The middle half sat between 5.6 and 9.8 s, with medians across five retail categories (electronics to garden) ranging from 7.2 to 8.0 s. First content (logo, menu) appeared at 2.2 s, main content at 7.8 s.
The median performance score (0–100) was 53: none reached 90, 4 scored 80 or above, and 34 fell below 50. Meanwhile, 77 shops scored 90 or above on SEO (meta descriptions, links, robots.txt)—and 66 of those took over 4 s to load main content.
The table summarizes the most common Lighthouse findings.
| Finding | Shops of 89 | Impact on shoppers |
|---|---|---|
| Main content after 4 s | 76 | Shoppers wait past Google's limit for photos and offers |
| Render-blocking files | 82 | Screen waits until styles and scripts finish |
| Unused JavaScript | 72 | Phone downloads code it does not need |
| Short cache lifetime | 67 | Repeat visits re-download the same files |
| Oversized images | 60 | Photos exceed what the screen needs |
| Main thread blocked over 600 ms | 49 | Visible page briefly ignores taps |
| Text waiting on fonts | 35 | Headings and prices wait for font files |
Cutting unused JavaScript would save the most time (34 shops), followed by images (21) and caching (19). Visual stability (CLS up to 0.1) passed on 83 of 89 shops. The median homepage weighed 3.2 MB across 142 requests.
This was a lab test of a first visit with an empty cache (150 ms latency, 1.6 Mbps—roughly the slowest quarter of 4G), not real visitors; faster connections show content sooner. Top-rated shops do not represent the market average, and we tested homepages once—the data highlights common bottlenecks, not store rankings.
According to HTTP Archive Web Almanac 2025, 48% of mobile sites and 45% of homepages passed Core Web Vitals in July 2025. That reflects real Chrome users, so it cannot be compared directly with lab runs.
Core Web Vitals are three Google metrics: LCP (loading), INP (responsiveness), and CLS (visual stability). Per Web Vitals, passing means hitting up to 2.5 s, 200 ms, and 0.1 on at least 75% of visits, separately on mobile and desktop.
| Metric | What it measures | Good threshold | Storefront analogy |
|---|---|---|---|
| LCP | Main content display | up to 2.5 s | When the shop window lights up |
| INP | Response to a tap | up to 200 ms | How fast a clerk replies |
| CLS | Whether layout jumps | up to 0.1 | Whether the shelf stays still |
LCP times the largest element in the first viewport, usually a hero banner or product photo (over 4 s is poor). INP measures response to taps like filters or Add to cart (over 500 ms is poor). CLS totals unexpected layout shifts, such as a late banner (over 0.25 is poor).
Field data comes from real visitors; lab data is a single simulated load. PageSpeed Insights pulls field metrics from the Chrome UX Report (CrUX) over the past 28 days. Google ranks using field data, while lab tests diagnose causes.
Numbers differ across devices, networks, and caches. Lab runs cannot measure INP because nobody taps—they show a proxy, Total Blocking Time (TBT).
The 0–100 score in PageSpeed Insights is a lab grade, not Core Web Vitals. Lighthouse calculates it as a weighted average of five metrics, led by Total Blocking Time (30%), LCP (25%), and CLS (25%). Scores of 90+ are good, 50–89 need improvement, and under 50 are poor.
In our test of Czech shops, time leaked through images, unused JavaScript, fonts, stylesheets, and short cache lifetimes. You can fix all of these without rebuilding your site.
According to Web Almanac 2025, an image is the LCP element on 76% of mobile pages. Lighthouse flagged images on 60 shops: full-resolution uploads or JPG and PNG instead of WebP and AVIF.
Lazy loading on the top banner slows display—yet 16 to 17% of pages do it. Across 38 shops, the browser discovered the hero image late, failed to prioritize it, or lazy-loaded it.
Unused JavaScript appeared on 72 of 89 shops and was the top bottleneck on 34. Phones needlessly download chat widgets, analytics tags, ad pixels, plugins, and unused theme code.
They block the page like a courier unpacking in the shop doorway. Total Blocking Time exceeded 600 ms on 49 shops (median 665 ms).
Text waited for custom fonts on 35 shops, while styles or scripts blocked rendering on 82. Fewer font weights, system fonts, and immediate fallback text solve this.
Browser cache stores site files on the visitor's phone. Cache lifetimes were too short on 67 shops, forcing returning shoppers to re-download logos, fonts, and scripts. Proper caching noticeably improves real-world LCP.
Read more on what a homepage should include and why shoppers abandon their cart.
Test your site free in five minutes with PageSpeed Insights (individual pages) and Search Console (whole site):
Lab results fluctuate with server, network, and computer load. The median of five runs is twice as stable as a single run—always compare medians under identical settings.
Start with high-impact fixes: images, third-party scripts, fonts, and caching. JavaScript, images, and cache yielded the biggest savings in our test. Leave theme or platform changes for last.
Compress your homepage hero image into WebP or AVIF and disable lazy loading on it so it downloads first. Most themes let you set this directly.
Audit third-party scripts and remove dead weight like old tracking tags or unused chat tools. Defer the rest until after main content, cookie consent, or user interaction.
Have your developer trim font weights, show fallback text immediately, and extend cache lifetimes. If your setup hits hard limits, see how to choose an e-commerce platform or how to handle a website redesign without losing traffic.
A performance budget puts speed limits into your contract. Think of it like a van's payload limit: adding a heavy feature means dropping another. Without one, sites slow down and nobody owns the problem.
Include mobile Core Web Vitals, pre-launch lab checks, and a page-weight cap in your brief (our sample's median was 3.2 MB).
Building speed in from the design stage costs the least. Planning an online store? Explore our e-commerce development or scope your project in our project configurator.
Focus on when main content appears. On mobile, aim for LCP within 2.5 s for at least 75% of visits (over 4 s is poor), responsiveness under 200 ms, and a stable layout. Among the 89 Czech online shops we tested, only 3 met the 2.5 s mark on their homepage.
Yes, though less than often claimed. Google factors in Core Web Vitals, yet prioritizes the most relevant content. Speed breaks ties between comparable pages. Its bigger impact is on shoppers—faster sites lift conversions and sales.
Lab tests vary with server, network, and device load. Run multiple tests and track the median—Lighthouse notes a five-run median is twice as stable. Field data in PageSpeed Insights aggregates 28 days, so it shifts slowly.
They are three Google metrics for real-user experience: LCP (main content, up to 2.5 s), INP (responsiveness, up to 200 ms), and CLS (visual stability, up to 0.1). Passing requires meeting them on at least 75% of visits. Check yours in PageSpeed Insights and Search Console.
Usually yes, within limits. You can compress images, delete unused apps and tracking codes, simplify your homepage, and pick a lighter theme. The provider controls the server, caching, and core scripts. If Core Web Vitals still fail, switching themes, platforms, or building custom is the next step.
Handpicked topics for you
Visitors form a first impression before reading a word and decide within seconds whether to stay. Here is what must be clear at the top and how to test it in an afternoon.
Seven in ten carts end without an order. Some shoppers just compare prices, while shipping costs, forced accounts, or missing parcel lockers stop others. Here is what to fix.
Most new online stores only need a hosted platform. Learn how to spot when you outgrow it and when custom e-commerce is an unnecessary expense.